Each year sees the production of millions of Pumpkins on extensive areas of agricultural land. Some of those Pumpkins are used to make pies, various baked goods and other sorts of edibles including Pumpkin seeds. The vast majority of the large orange fruit are either destined for Jack-o’-Lanterns at Halloween or are not even harvested. A cynic may suggest that the entire cultivation of Pumpkins involves rather frivolous use of agricultural land. Those people that do grow the crop in a conscientious manner can realize a good profit for their efforts.
Pumpkin crop, Huttonville, 2003
Pumpkin harvest, Scotch Block, 2016
Of the pumpkins that are acquired by members of the general public, the majority become Jack-o’-Lanterns but some are kept intact as ornaments. The latter obviously remain in an intact form. When Jack-o’-Lanterns are produced, two basic products will result. One of these is the outer shell that is further carved into the standard Halloween face. But in order to get that stage, the innards and seeds become a material that needs to be managed. Sometimes, the seeds are saved as a snack food. The inner part is something that has no real value to humans and the shells of the seeds fall into the same category. After a short life as a Jack-o’-Lantern, Pumpkins become a bit of a problem on November 1st each year. They soon start to show signs of deterioration (loss of water due to the cut surfaces) and people start to look for ways to dispose of them. This issue regarding what to do with them is at the core of this article.
Pumpkins dumped at Nassagaweya Line, 2021
In recent years, it has become increasingly apparent that people are not following good practices regarding their used Jack-o’-Lanterns. A fair number appear to be smashed in place by vandals while others have ended up being thrown out along roadsides, in parks, and in various woodlots. There may be some value of the Pumpkins as food for wildlife but disposal could lead to attraction of the wrong kinds of wildlife or possibly even releasing Pumpkins as a wild plant if seeds are left within the Jack-o’-Lantern. Disposal of Pumpkins in natural areas may be contrary to local by-laws. Most municipalities have had to develop rules or guidelines for their own local area because of the scale of the Pumpkin waste. There may be some slight variations from place to place regarding the disposal of the unwanted Pumpkin waste so people are advised to check the rules that are relevant to their own particular location. Generally, in our area, people are asked to place their unwanted Pumpkins in with their yard waste or to include them in their own backyard compost pile. They are preferably not to be included within green bins and are definitely not wanted in general garbage where they take up landfill space. They should not be thrown out along roadsides or in natural areas.
In contrast to the weather experienced for the 2013 Christmas Bird Count in the aftermath of the ice storm that year, the weather for the 24th annual Christmas Bird Count on December 27, 2014 was quite delightful. Although there was a very brief light shower around noon, the lack of snow made for excellent survey conditions. The temperatures that got to approximately 10C in the afternoon were probably the second highest in the 24 years that the survey has been undertaken. The survey had a new high total of 33 participants.
The results of the tally for Count Day and Count Week are summarized in the attached table. The number of species reported was 60 plus one hybrid, which exceeds the previous high of 57 species seen in 2003. Despite the large increase in numbers of Canada Geese (over half of the total), the total birds was 8413. The total of counted birds was lower than the long term average by more than 1300. Six species (Ruffed Grouse, Snowy Owl, Golden-crowned Kinglet, American Robin, White-throated Sparrow, and Pine Siskin) made the final list but were not tallied on Count Day.
Eight species were present in new high numbers. These included Trumpeter Swan (2), Northern Shoveler (7), Bufflehead (2), Common Goldeneye (22), Cooper’s Hawk (7), Eastern Screech Owl (6), Red-bellied Woodpecker (18), and Common Raven (4). Twenty-six species were present in numbers below average. The single Common Redpoll was the lowest count recorded to date when the species is actually present; however, this is a highly-eruptive species with numbers as high as 1670 in 1997 and present only about every other year.
The unusually warm conditions and lack of snow in combination with extra observers likely affected the overall results. The lack of snow would cause fewer birds to require food from feeders though most feeders observed were not filled. Despite the annual variability in numbers observed over the duration of the Halton Hills Count, we can conclude that numbers of Canada Geese, Common Raven and Red-bellied Woodpecker are increasing while the numbers of American Kestrel have declined.
Thanks to the following participants: Ray Blower, Alexis Buset, Mark Cranford, Melissa Creassey, Emily Dobson, Kim Dob-son, Ramona Dobson, Pam Forsythe, Ann Fraser, Sandy Gillians, Ian Jarvie, Aaron Keating, Dan MacNeal, Lou Marsh, Merle Marsh, Katie McDonnell, Bill McIlveen, Irene McIlveen, Matt Mills, Dan Pearson, Johanna Perz, Fiona Reid, Dawn Renfrew, Don Scallen, Adhara Collins Scholten, Yves Scholten, Dan Schuurman, Rick Stroud, Janice Sukhiana, Patrick Tuck, George Wilkes, Marge Wilkes, Dave Willams.
Many thanks once more to Larry May for arranging access to the Maple Lodge Farms property and to Fiona Reid for hosting the wrap-up session.
All readers must surely have heard of the ongoing outbreak of the Ebola hemorrhagic fever that is occurring in several countries in West Africa. The disease is indeed a nasty one that starts with a fever, muscle pain, and headache followed by vomiting, diarrhea, and impaired kidney and liver function. Internal and external bleeding may also occur. The mortality rate of the current outbreak stands at about 70%. As of 14 October 2014, 9,216 suspected cases and 4,555 deaths had been reported. Given that the total population of the three main affected countries, Liberia, Sierra Leone, and Guinea, is over 22.1 million people, this translates to only 0.041% of the population infected. While this may seem to be a very small proportion, it must be realized that the number of people infected is continuing to increase.
Ebola hemorrhagic fever is caused by a virus. Among a large number of virus diseases affecting humans, there are some rather familiar types including AIDS, chickenpox, common cold, hepatitis, influenza, rabies, shingles, measles, SARS, West Nile fever, and yellow fever. Many of these have multiple strains. A virus is not a living organism though it does share some characteristics with pathogens of plants and animals. Instead, viruses are essentially sections of rogue DNA or RNA genetic material surrounded by a protein coating. They are capable of reproducing (increasing in number) by causing their host to make more copies of the virus, each one capable of causing the disease in the host.
All living species as well as viruses need to be able to reproduce themselves. If they don’t, then, over time, they will simply die out. If a species is to retain a stable population, then they need to replace themselves on a one for one basis. In the case of animals including humans, the female must, during her lifetime, produce two offspring (male and female on average) that live to reproduce themselves. Of course, not all offspring will survive to do so therefore the females must produce in excess of the minimum to compensate for the premature loss of the young. If she doesn’t, the species will die away. If she produces more than the number required to maintain the status quo, then the population will increase. This is simply a basic biological principle that often gets overlooked.
Figure 1. Examples of population growth curves for species reproducing at different rates.
In general, a reproducing population will increase at rates in excess of the minimum. The rate of increase is much like the way one must pay interest on the portion of an unpaid loan or receives interest (albeit very low these days) on a bank account. The longer that such an account exists, the greater will be the amount of accrued interest. The same thing applies in biological systems and the data can be plotted mathematically in graphs (Fig. 1). The rate of increase, ‘r’, can vary widely. A plant for example may produce just a few seeds or may produce thousands of seeds each year. The larger the number of seeds that are produced, the faster that an unchecked population can grow. When a population of some species is growing at a high rate (e.g. a rate higher than we humans wish it to be), we reach epidemic or invasive proportions.
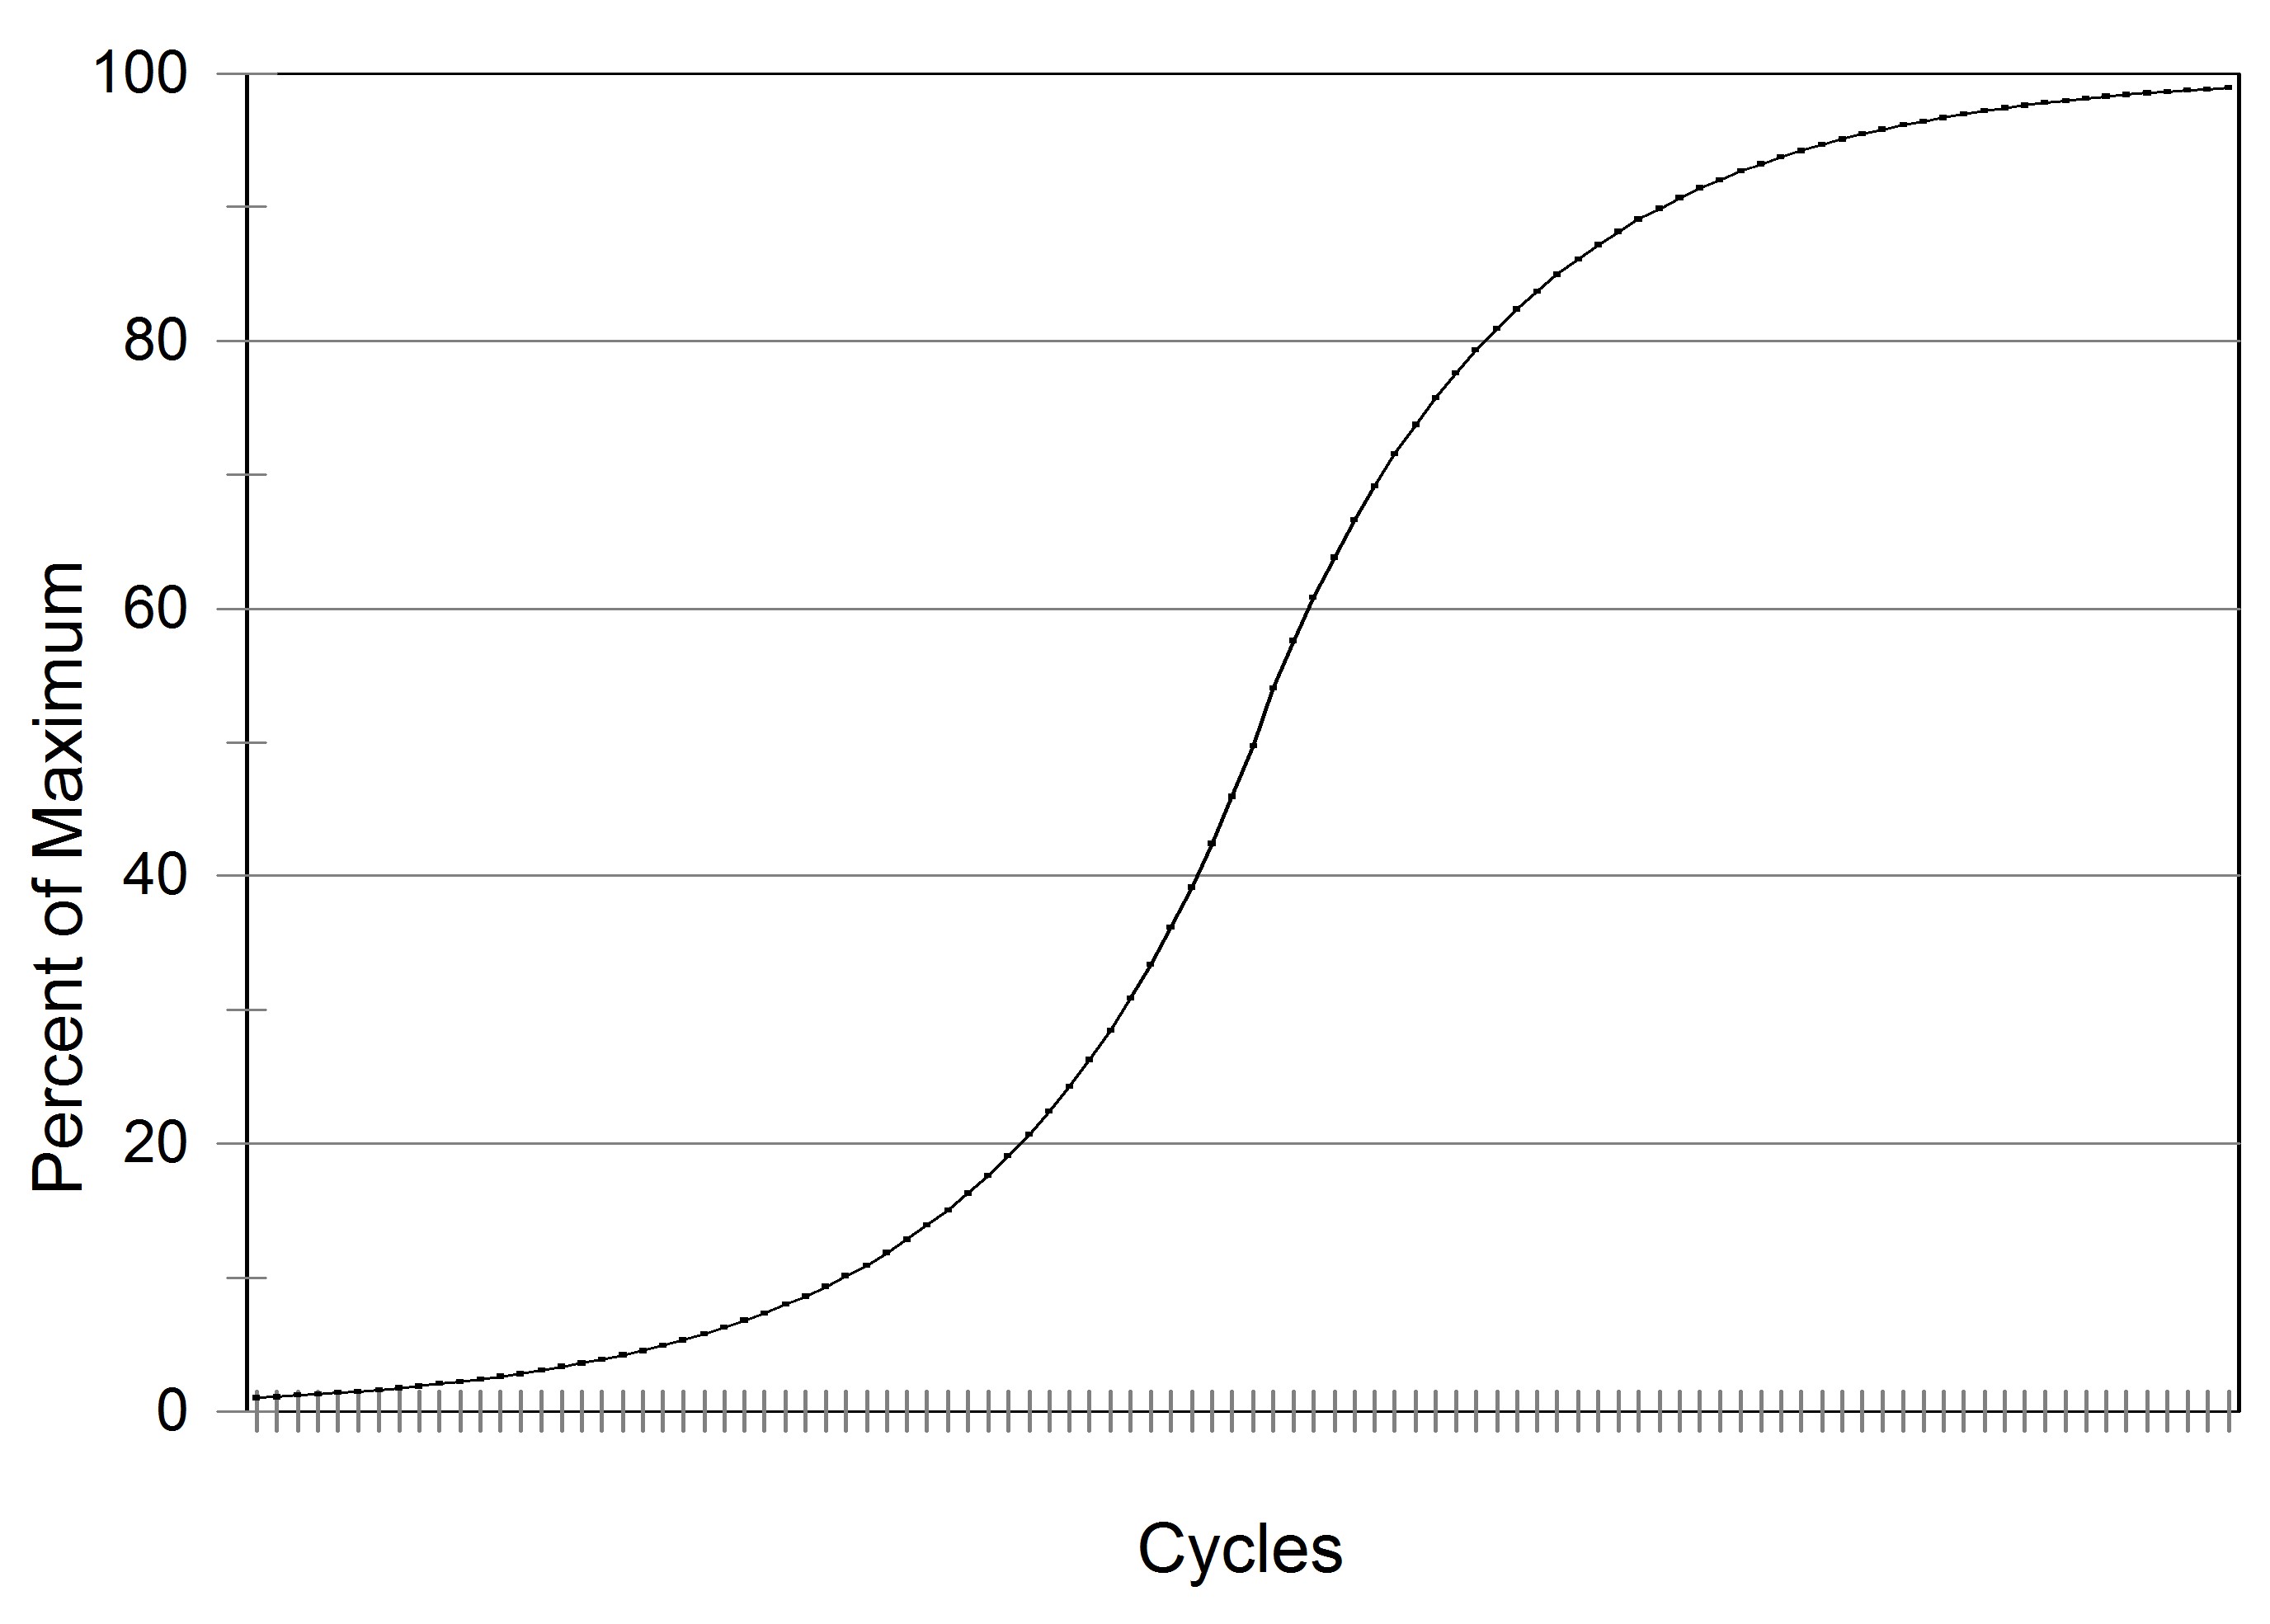
Figure 2. Graph showing the ‘s-shaped’ pattern of colonization of a suitable habitat by an introduced organism.
In reality, a species will typically increase until there is no more space available or all of the resources are used up (Fig. 2). Dandelions, for example, will spread in a newly cultivated field until there is no more space left in which a seed can germinate and grow into a new plant. Disease organisms such as potato blight will spread through the crop until it has infected all of the available host foliage. The same principle applies to all organisms – fungal, bacterial, viral, insect, mammal, etc. Populations simply cannot increase forever. As well as exhausting all available resources or space or hosts, other factors will often have a bearing on the situation for they too will become hosts for a different type of organism. For example, an infestation of caterpillars on a crop will be subjected their own set of parasites and hyper parasites that keeps the population in check. And it is never in the long-term interest of a parasite to kill all of its hosts.
In reality, not every seed will germinate, or the conditions for growth are not suitable, or the plant or whatever organism is itself subject to its own parasite. In a balanced natural system, the growth of populations of all types of biological entities is constrained and the system functions as nature intended. The problem comes when a particular species does not have its inherent control systems. This is usually the case (initially) for a newly introduced species and it reaches undesirable numbers. This applies to plants, insects, fungi, bacteria, viruses, etc. But the net effect of all the factors that may come into play are keeping the ‘r’ rate lower.
Now, in relatively recent times, the computer programmers needed a word to apply to situations when malicious software was introduced into the electronic communications used by functioning computers. They latched on to the term ‘virus’ from the field of biology for they considered the desirable programs running on the computer to be ‘infected’ by the undesirable software. They could have just as easily used the term ‘fungal’ or ‘bacterial’ or even ‘epidemic’ to indicate the ability of the software to spread to other computers. The application of the term ‘viral’ still remains incorrect. Even more recently, people have used the term ‘viral’ to indicate the rapid spread of a photo, film clip, or some type of information among cell phone users and the like. The use of the word in this way is quite different from that where the malicious software is involved. It is even more distant from the true meaning of ‘viral’ and its use should be discouraged. Hopefully, time will cause the term to become obsolete in this manner of use and that its use will return to where it truly belongs – restricted to the world of virologists that are dealing with the spread of real issues including infectious diseases such as Ebola.
About two years ago, there was an event that made a notable item in the news. This was the phenomenon where the planet Venus traces a course across the face of the sun. This happened on June 5, 2012. A similar transit took place on June 8, 2004. Transits of Venus are rare events, occurring in pairs about eight years apart but separated by periods of over a century. As notable as this recent event might have been, it was rather minor in significance by comparison with the attention paid in 1769 as described below.
Venus (small dark circle) entering face of sun, Acton Library, June 5, 2012. Photo made with hand-held digital camera and telescope. Photo by W.D. McIlveen.
During the 18th Century and onward, marine shipping around the world was increasing in importance, whether for commercial or military purposes. A critical part of this activity was the dependence upon the ability of ships to navigate the seas. At this time, ship captains could determine their latitude reasonably well based on the technology that existed at the time. The matter of knowing their longitude was an entirely different matter. By not knowing both the latitude and longitude, it was very difficult to know their true position and as a result, a great many ships were lost in various mishaps at sea.
In 1716, Edmund Halley realized that the problem of longitude could be resolved by understanding the direction, angular separation of planets and stars and the distance between them. A critical factor is knowing the distance of the earth from the sun. Halley realized that an ideal opportunity for making this distance measurement would occur by accurately observing the transit of Venus across the face of the sun and using this information in some complex mathematical calculations. He knew that the next such opportunities for making the needed observations would happen in 1761 and 1769. Although he never lived long enough to witness the results of the work carried out by astronomers making the measurements, he did set in motion an international process to collect the critical information.
Based on sea voyages to St. Helena and Barbados in 1764 and celestial observations made there, Nevil Maskelyne, Astronomer Royal of England, was able to produce a book of tables, The Nautical Almanac, in which the position of the moon for every noon and midnight was forecast for several years into the future. From these tables, navigators could estimate a longitude to a greater degree of accuracy than they could before that date. The required accuracy was still not sufficient and detailed observations on the next transit of Venus were needed.
Some early measurements of the transit of Venus were undertaken at Tobolsk, Siberia by Jean-Baptiste Chappe d’Auteroche on June, 6, 1761. Despite support from the empress, his trip from Paris to the viewing site was difficult to say the least, but he did manage to obtain the needed data.
Various competing but cooperative ventures were launched to observe the transit of Venus on June 3, 1769 at different points around the globe. A number of these failed completely because the skies were covered in cloud at the critical moment or because of travel logistics and political conditions. For example, Le Gentil from the French Academy of Science could not land at the intended outpost of Pondicherry in the Indian Ocean because the port had fallen into the hands of the British. He could not operate the telescope properly on the deck of a floating ship so his efforts produce nothing of consequence. Also, in 1769, the surveyors Charles Mason and Jeremiah Dixon (whose names live on in the form of the Mason-Dixon Line in the United States) were commissioned to set up an observatory at Bencoolen, Sumatra. A series of delays beyond their control caused them to shorten their trip so that they were only able reach Cape Town. They set up their observatory there but were able to collect only partial details due to clouds on the critical day.
Three teams of observers did collect the required data. One team consisted of Father Maximilian Hell and Joannes Sajnovics from Hungary. After a harrowing trip along the edge of fiords, stormy fall seas and spending the previous long dark winter on an island at Vardos off the north coast of Norway, they set up an observatory and made the needed observations. By comparison, Chappe was sent to collect the data San Jose del Cabo on the tip of Baja California. This required a trip on horseback across Mexico in the company of Spanish co-observers Vincente de Doz and Salvador de Medina followed by a boat trip across the Gulf of California. Chappe had the misfortune to arrive at his destination in the midst of a serious outbreak of typhus. Although he fell victim to the disease himself, sheer will power saw Chappe complete his task. He survived until August 1 when he too died. Fortunately, his assistant was able to bring the data back to Europe where the information could be utilized. Perhaps the most famous observer team that successfully collected transit information was that of Captain James Cook and his senior observer Charles Green. They made their way to the island of Tahiti in the Pacific Ocean after rounding Cape Horn. On that trip, the young botanist/naturalist Joseph Banks was a paying passenger. He was out to collect botanical and other natural history information along with his own team of servants and assistants. Fortunately for the expedition, Banks was more diplomatic than Cook and so he was able to retrieve the critical instruments stolen by the Tahitian natives who were enthralled by any metal objects. But Cook’s expedition experienced good weather for the observation date and they obtained all of the required data.
The data collected by all of the observers eventually was to pass through the clearing house set up under the auspices of the Royal Academy of Science in Paris. At the time, Jerome Lalande was in charge of processing the data. He was somewhat arbitrary in selecting the data that he accepted and rejected. This led to a public and heated spat with Father Hell. Lalande’s approach led to a measurement of the distance to the sun that was less accurate than some of the collected data would have indicated. Since then, more accurate measurements have been made using other techniques but the technology used in 1769 was the most advanced at that time.
The next pair of Venus transits will occur on 10–11 December 2117 and in December 2125. Not many people alive for the most recent transit will be alive to witness the next.
Reference Anderson, Mark, 2012. The Day the World Discovered the Sun. DaCapo Press, Philadelphia. 280 pp.
During the summer of 2014 (May 26 to August 25), a total of 14 evening walks were organized for various areas of Halton and Peel Regions. The site locations are listed in the following table along with the names of the leaders and the numbers of participants on each walk. An attempt was made to alternate sites in the south and the north part of the area. Overall, there were five different leaders (Ray Blower, Kirsten Burling, W. McIlveen, Dawn Renfrew, and Leanne Wallis).
One of the walks was cancelled due to heavy rain which reduced the potential attendance and to eliminate any safety concerns that wet trails might cause. Excluding the cancelled walks, the numbers of participants (excluding the leaders) ranged from two to 9 with an average of six participants per walk. This is very close to the attendance in 2013. There was a small core group of participants that came out for most walks but there were also many walks where the participants were infrequent attendants. Two were not typical walks. The trip that took place on the weekend of August 9 and 10 went to two oak savannah sites in Windsor and to two sites at Point Pelee. At those locations, the participants were treated to fine weather and saw many rare species of plants and butterflies. The trip on August 18 met in Limehouse but the event actually happened in Glen Williams where we participated in the ‘Shadfly Festival’ and we got to see huge numbers of mayflies emerging from the river.
Overall, comments from people that did come out for the walks indicated that they found the trips to be interesting and enjoyable.
26-May-2014
Conely Tract
Bill McIlveen
6 people
2-Jun-2014
Indian Ridge Trail
Bill McIlveen
6 people
9-Jun-2014
Jacquith property
Dawn Renfrew
9 people
16-Jun-2014
Arbourview Woods
Bill McIlveen
5 people
23-Jun-2014
Silver Creek at 8th Line
Leanne Wallis
rained out
30-Jun-2014
Iroquois Shoreline Park
Bill McIlveen
5 people
7-Jul-2014
Limehouse Area
Dawn Renfrew
4 people
14-Jul-2014
LaSalle Park
Bill McIlveen
3 people
21-Jul-2014
Limehouse Area Springle
Dawn Renfrew
6 people
28-Jul-2014
Beachway Park
Bill McIlveen
10 people
4-Aug-2014
Limehouse Area
Ray Blower
6 people
9/10-Aug-2014
Windsor Weekend
Bill McIlveen
6 people
18-Aug-2014
Limehouse Area
Ray Blower
6 people
25-Aug-2014
Rattray Marsh
Kirsten Burling
8 people
It is anticipated that evening walks will be continued in 2015. If possible, we will try to time one of the evenings in August to take place at the time of the Shadfly Festival. Consideration will also be given to having one evening walk coincide with a Chimney Swift count (e.g. Oakville).
On February 27, 2014, the International Joint Commission [I.J.C., 2014] released a report on the most recent algae bloom problem in Lake Erie. That report had much in common with a similar problem that existed in the Great Lakes about 50 years before. That problem was the association between phosphorus loading in the water column and the subsequent growth of algae, most conspicuously Cladophora glomerata, though blue green bacteria and other species constitute additional problems.
Figure 1. Cladophora on shore of Lake Ontario at Lorne Park, Mississauga, 1969. Photo from Mississauga Public Library collection.
Algae, like all aquatic organisms, are dependent upon the chemical constituent chemicals in the surrounding water. Generally, chemical concentrations in the water are quite dilute. As it turns out, the essential chemical that is most limiting for algal growth is phosphorus. As a result, small increments in the level of soluble phosphorus cause large responses in growth of the algae. When phosphorus levels in lake water increased up into the 1960s, excessive growth of algae occurred in the Great Lakes. The algae washed up on the shores of the lake (Figs. 1 and 2) where it began to decay and caused very unpleasant odors. Decaying algae consumes oxygen and when this happens in the aquatic environment, the eutrophic conditions with insufficient oxygen become limiting to many organisms including fish.
Figure 2. Cladophora on shore of western Lake Ontario 1969. Photo by W.D. McIlveen
There were many sources of the phosphorus, however, the prime source was attributed to detergents used by human residents around the lakes [Schindler, 2008]. Despite fierce resistance from the soap and detergent industry, they were forced to remove the phosphate-based chemicals from their product by 1972. Following this, phosphorus levels in the water gradually declined and the algae problem generally improved. The removal of phosphorus from detergents did not permanently solve the problem. There was year to year variation in algae growth and the problem appeared in years of heavy growth (Fig. 3).
Figure 3. Cladophora on shore of Lake Ontario at Jack Darling Park, Mississauga, Sept. 11, 2011. Photo by W.D. McIlveen
Over time, the human population around the lakes increased further. Other sources of phosphorus grew including releases from sewage treatment plants. As well, new complicating factors appeared. Global warming caused earlier warming of the near-shore waters with the result that alga populations could become established earlier in the Spring. The appearance of the Zebra (Dreissena polymorpha) and then Quagga (Dreissena bugensis) Mussels made major changes in water quality. These species filter huge quantities of water with the result that water is made clear. With clearer water, light could penetrate to greater depths and this effectively extended the area over which the algae could attach and grow. More growth means more problems. Other introduced species such as the Round Goby (Neogobius melanostomus) and large populations of waterfowl that now feed on the mussels further complicate the picture.
In Lake Ontario, the water current in the western portion of the lake is generally counter clockwise when seen from above. This means that the currents along the shoreline off Peel and Halton are from east to west. The Halton shoreline is therefore downstream from any sources of phosphorus in Peel and the City of Toronto. In addition, the nature of the shoreline with piers and other structures influence the movement of the water and can cause floating algae to become trapped. Winds and storms can deposit, and remove, algae on the shore where it is an unwelcome caller in the minds of local residents.
The recent report by the IJC [IJC, 2014] has concluded that the most recent problem of algae in Lake Erie was mainly due to agriculture. This includes large animal production facilities and heavy use of fertilizers for crop production around the Lake. As well, residential use of fertilizers for lawns and gardens contribute a significant amount of phosphorus. The latter source was also confirmed in studies completed in Halton [Aquafor Beech, 2006]. These sources need to be addressed or the eutrophication problem will persist and grow. It is still too early to know what measures will be undertaken in coming years. Phosphate-free lawn fertilizer may be mandated for home-use for example. Conditions around Lake Erie must be altered or the algae issue will continue and grow. The so-called ‘dead lake’ state could return even though eutrophication actually represents a hyper-lively water body.
References Cited:
Aquafor Beech Limited. 2005. Final report prepared for Conservation Halton LOSAAC Water Quality Study. 127 pp.
International Joint Commission. 2014. A Balanced Diet for Lake Erie: Reducing Phosphorus Loadings and Harmful Algal Blooms. Report of the Lake Erie Ecosystem Priority. 100 pp.
Schindler, D.W. and J.J. Vallentyne. 2008. The Algal Bowl – Overfertilization of the World’s Freshwaters and Estuaries. University of Alberta Press, Edmonton. 323 pp.
by W.D. McIlveen – Halton/North Peel Naturalist Club
The 23nd annual Christmas Bird Count that took place on December 27, 2013 will be a most memorable one. The outstanding feature of the Count will be remembered not so much for the count results as for the weather that occurred a few days earlier. That weather included freezing rain that amounted to at least three cm of ice over all exposed surfaces. The consequence of the ice was extensive breakage of tree branches and electrical power outages that were still happening in parts of the survey area. Overall, there were 23 participants that took part in the field observations or checked their feeders.
Generally, the Count produced close to average results based on comparisons with previous counts in the case of numbers of species reported – 49 species on count day vs. 50 species for the long-term average. By contrast, the total numbers of birds seen was 5239 – slightly over half of the average of 9760. The results for the individual species are presented in the attached table. A new species for the Count was a Turkey Vulture that was reported to the OntBirds website. Only one species, the Red-bellied Woodpecker was present in record high numbers with 15 birds seen. Many species were reported at low numbers, both below average and at new lows. The new low numbers were noted with Mallards (26), Black-capped Chickadees (243), American Tree Sparrow (55), and Northern Cardinal (22). No Black Ducks were observed. Wild Turkey (50), Hairy Woodpecker (26), Blue Jay (171) and American Robin (95) were noted in above average numbers but not in record high numbers. The species that made it onto the Count Week list were Snowy Owl and Snow Bunting.
The impact of the ice storm that appeared to generally lower the observed bird populations cannot be assessed with any certainty. In part, the lower numbers of ducks and geese might also be correlated with early freeze-up of local water bodies. This would not explain the lower numbers of the more-terrestrial species. Only time will tell whether the decreased numbers are merely a blip or part of a long-term trend.
There is little doubt that the winter solstice of 2013 will be one to remember for a long time to come. The situation was certainly not unprecedented for some freezing rain occurs in most winters. And the amount of rain that fell was less than that that which happened in the great ice storm of 1998 in Ontario. Yet the extent of area that was impacted and the number of people affected in 2013 might well be much greater. More time will be required for a proper assessment of the effects to be completed but the following is a preliminary set of observations from our area.
Fig.1 – Map of precipitation pattern in Ontario for December 20, 2013 from CBC News
The storm was not a single event but two similar storms that followed the same track about two days apart. As it turns out, our area fell zone where the ambient temperatures were too low for the precipitation to fall as rain and too warm to fall as snow. As measured at the Pearson Airport, the amount of rain that fell on December 20 was 8.6 mm followed by 16.6 mm and 13.6 mm on the two days following respectively for a total of 38.8 mm. The distribution of the rainfall as shown in the attached map obtained from the CBC weather forecast indicates that the highest amount of rain was expected further west of Toronto so it would not be unreasonable to expect that we experienced well over 40mm. By comparison, the amount of rain reported during the 1998 storm was 85 mm in Ottawa, 73 mm in Kingston, 108 in Cornwall and 100 mm in Montreal.
Fig. 2. Woods with ice damage, Nassagaweya-Esquesing Line north of Sideroad 15
The net result was an accumulation of a thick layer of ice on all exposed surfaces. The thickness on tree branches was observed to be at least 30 mm on the upper side surfaces. Considering the possibility of dripping, three dimensional distribution and multiple of layers branches, it is conceivable that the true amount of rain here was perhaps double that measured at Toronto. It appeared that the amount of damage above the Niagara Escarpment was greater than that at lower elevations.
The ice that accumulated resulted in a huge weight stresses on the tree branches. Although many factors are involved, the stress resulted in a great amount of branch breakage. It was estimated that about a quarter of the tree canopy in Toronto was damaged by the ice. Falling branches caused extensive damage to power lines and many support poles were broken. It took up to ten days to get all power restored. Fallen branches also blocked sections of roadways.
Fig. 3. Ice damage to willows, Dublin Line.
There are additional factors to consider including species involved and branching patterns of individual trees but two patterns were evident in the breakage. Large branches that broke were often suffering from some previous damage or decay, especially when the branch crotches were narrow. The second thing was the there were huge numbers of smaller branches that were broken, usually in the upper crown. The branches affected exhibited a reasonable consistency in diameter where the break occurred. This was at branch diameters of 6 to 10 cm. It seems reasonable to conclude that the wood strength at diameters greater than this were able to support the load of ice. At lower diameters, the individual twigs were flexible enough to withstand the ice. But at the indicated diameters, the branches supported a certain combination of number of twigs of a particular length such that the critical load-bearing strength of the supporting branch was exceeded and so it broke. A very similar pattern was evident in Eastern Ontario following the storm of 1998. When trees did not break, the trunks bent under the load. In some cases, species such as poplars and birch bent to a high degree, sometimes involving trunk diameters that were well in excess of what one might expect as possible.
Despite the obvious damage, especially where entire trees had to be removed, the long-term impact likely to be limited. Broken branches will undoubtedly reduce the rate of growth of the trees for a short period of time. It is to be expected that broken branches will create potential infection courts for decay to become established. Studies of this kind were initiated following the storm of 1998 but the results of those studies have not been widely distributed. When one travels through eastern Ontario, it is becoming increasingly difficult to see broken branches as the branches lower on the trunk have grown and surpassed the point of the break.
While we cannot say with certainty that a similar storm will or will not occur again in the near future, the possibility for such a storm will always remain. While it may be counter intuitive that an ice storm resulted from global warming, that may in fact be the case. Global warming is expected to alter the frequency and severity of storms but storms can occur in all seasons. It will not be possible to attribute any individual storm to climate change. All we will be able to do is observe that more storms occur and deal with them as they arise.
The situation regarding invasive species is never static. Periodically we get good news mixed in with the gloomy reports of some new species that has appeared at our door. And so it is that we have some recent changes in local matters pertaining to invasive alien species.
Starting with the bad news first, the Asian Longhorn Beetle (Anoplophora glabripennis) which attacks a wide range of tree hosts had been declared eradicated from the Cities of Toronto and Vaughn. By 2003, the beetle had established a modest area of infestation in the boundary area between those municipalities. An intensive program was launched to eliminate the infestation by cutting and destroying all of the host trees within a 400 metre radius of the infestation. After detailed surveys of the area had found no more indications of the beetle for a period of five years, the pest was declared eradicated by the Canadian Food Inspection Agency (CFIA) on April 5, 2013. Unfortunately, a new infestation was detected in an industrial area on American Drive near Pearson International Airport in Mississauga on September 20, 2013. It is not known if the two areas of infestation are connected. They are not located too far apart so a connection cannot be ruled out though a new source of infestation is presumed. Multiple points of infestation are known at other locations in North America where similar eradication programs had been carried out. Some trees have already been cut down and it is expected that a similar form of eradication program will be undertaken to insure that the beetles do not spread.
Figure 2. Larva of Hypena opulenta
On August 23, 2013, Credit Valley Conservation (CVC) reported that two round gobies (Neogobius melanostomus) were caught in the west Credit River at Hillsburgh. Additional surveys found at least 50 more of the fish just downstream. Previously, the species had been found only at sites in the catchment area where the water was closely connected to Lake Ontario, a location where the species has become well – established. It seems improbable that the fish had made it to Hillsburgh across dams and other obstacles without some sort of human intervention, whether intentionally or unintentionally. A program to manage the problem species needs to be developed in concert with MNR, CVC, local land owners and other stakeholders.
Not all news concerning invasive species is bad. In 2006, moth larvae were found feeding on swallow-worts in southern Ukraine. The larvae were brought to the Commonwealth Agricultural Bureau International (CABI), a highly recognized facility that studies biological control agents, in Switzerland for rearing and initial testing. The moths were found to be host-specific and very effective in controlling the host plant. Additional testing was done at the control facility at the University of Rhode Island to verify the results. The tests were so successful that the University petitioned the U.S. Department of Agriculture in 2012 to allow for the release of the moth to control the Swallow-wort problem. The US still requires one additional step before approval is granted but that approval appears to be easily achievable (after the current political financial situation is resolved in that country). The application though has met all of the conditions set by Canada concerning the release of a biological control agent. As a result, 500 of the moth larvae were released at infested sites near Ottawa. So far, the caterpillars appear to be surviving well and the populations are being monitored. In time, it is not unreasonable to expect to see the moths make their way to our area. While there are many areas in the Province where Swallow-worts are a problem, there are many places around Toronto (e.g. Don River Valley) where the populations are very dense. The moth is known as Hypena opulenta (Figure 10). It resembles a few other Hypena species that occur in our area; however, those other species do not feed on Swallow-wort. This similarity and any resulting confusion may hinder the monitoring of the spread of the species into our area but the presence of the distinctive caterpillars (Figure 2) feeding on the plants should be easy enough. Naturalists should be on the lookout for these caterpillars wherever the Swallow-wort is present though it may take several years to reach here on its own.
Ontario is home to five species of rabbits and hares. These include the Arctic Hare (Lepus arcticus), White-tailed Jack Rabbit (Lepus townsendii), Snowshoe Hare (Lepus americanus), Eastern Cottontail (Sylvilagus floridanus), and the main subject of this report, the European Hare (Lepus europaeus). The first two species do not extend into our area at all. Arctic Hare barely get into the most northern parts of the province while the White-tailed Jack Rabbit is included on the basis of a few records from the Rainy River District. The Snowshoe Hare is our most widespread species in Ontario but we are situated at the southern edge of its range so we do not often encounter it unless we travel a short distance further north. In our area, the species that we are most likely to encounter is the Eastern Cottontail. Their populations go through a cycle of abundance and scarcity. It was seldom if ever encountered by European settlers until the mid-1800s and is regarded by some as a species that has expanded its range into Ontario. Skeletal remains found in a First Nations village in Oxford County prove that the species was here long before the supposed arrival in Ontario in 1868 [MacCrimmon, 1977]. There is little doubt though that after its recent arrival, their populations have dramatically increased as the species spread across all of southern Ontario [Dobbyn, 1994] (Map 1). As well as the five wild species noted above, from time to time, the Domestic Rabbit (Oryctolagus cuniculus), escapes from captivity or is purposely released by owners that no longer wish to keep them as pets. These animals do not persist in the wild for any significant period after they are released.
Map 1. Distribution of European Hare in Southern Ontario (Dobbyn, 1994)
The story of the European Hare is quite well documented [MacCrimmon, 1977]. They were introduced to Ontario just over one hundred years ago although some of that species was introduced some years earlier in the eastern United States. In 1912, Otto Herold, the manager of Bow Park Farm located near Brantford imported seven female and two male hares from Germany. Inevitably, they soon escaped. Their numbers increased and they soon spread in all directions from the Bow Park Farm. It expanded its range to cover most of the area south of the Canadian Shield [Dobbyn, 1994]. The peak populations in Ontario appear to have been reached by about 1950. Later attempts to introduce the species to Thunder Bay and Cochrane areas as a new game species were not successful as the hares could not tolerate the conditions in the north.
In 1921, Howitt [1925] reported quite successful hunting of Jack Rabbits in Beverly Township in Wentworth County about 15 km southeast of Cambridge which was then named Galt. This was only nine years after the Hares had been released.
While the hunting community was happy to have a new game animal, farmers trying to grow grain (e.g. winter wheat,) alfalfa, clover, or orchard crops had to contend with a new pest that damaged their crops, especially during the winter. Wild plants were also consumed by these relatively large animals.
As a youngster growing up on a farm on Mississauga Road, it was fairly commonplace to see these animals in the fields. We viewed these animals, usually referred to as Jack Rabbits, as a normal part of the local fauna and we were generally oblivious to the fact that they were not native. Species such as Groundhogs because of their burrowing and Starlings because they were ‘dirty birds’ were a much greater concern. As well, foxes that occasionally took a turkey from the field were a particular nuisance.
Map 2. Location of European Hare sightings in the GTA since 1987
In 1985, we returned from the North to live in this area. A few years later, I began to include mammal sightings in my records and included observations of the European Hares. While the annual numbers of observations were never large, I had records of the species from 1987 to 1998. The records from the GTA are summarized below and the locations are shown in Map 2. Many of the records were made during travel from Acton to Toronto along the Go Train routes. Since 1998, I have not seen the species. The realization that it had been several years since the last observation prompted this report. While there may be other reasons for the disappearance, it would seem that decline in Hares coincided with the increased populations of Coyotes. A parallel decline in numbers of Groundhogs has also occurred in the same general time period. By contrast, Cottontail populations have continued to go through a cyclical pattern.
The local Conservation Authorities (C.V.C, and Conservation Halton) were consulted to determine what records they had in their databases for European Hares. Most of their records were actually ones that I had contributed. The only recent record for the species was a sighting of a Hare at the Frank Tract in Nassagaweya Township by Bob Curry on June 3, 2003. That makes it ten years since we have had a report of the species for our area.
Acknowledgements
Many thanks are extended to Jacqueline Kiers (C.V.C.) and Brenda van Ryswyk (Conservation Halton) for reviewing their agency records of European Hare.
References Cited
Dobbyn, J. 1994. Atlas of the Mammals of Ontario. Federation of Ontario Naturalists, Don Mills, Ontario. 118 pp.
Howitt, H. 1925. Another Invasion of Canada. Can. Field-Nat. 39: 158-160. MacCrimmon, H.R. 1977. Animals, Man and Change. Alien and Extinct Wildlife of Ontario. McClelland and Stewart Ltd. Toronto. 160 pp.
by W.D. McIlveen
Halton/North Peel Naturalist Club
serving Brampton, Georgetown, Milton, Acton, Caledon & surrounding areas
Meetings are held at St Alban the Martyr Anglican Church
537 Main St,.
Glen Williams
On L7G 3T1